Haben Sie noch nichts passendes gefunden? Stöbern Sie durch unser komplettes Sortiment.
Oder melden Sie sich an bzw. registrieren Sie sich.


Beschreibung
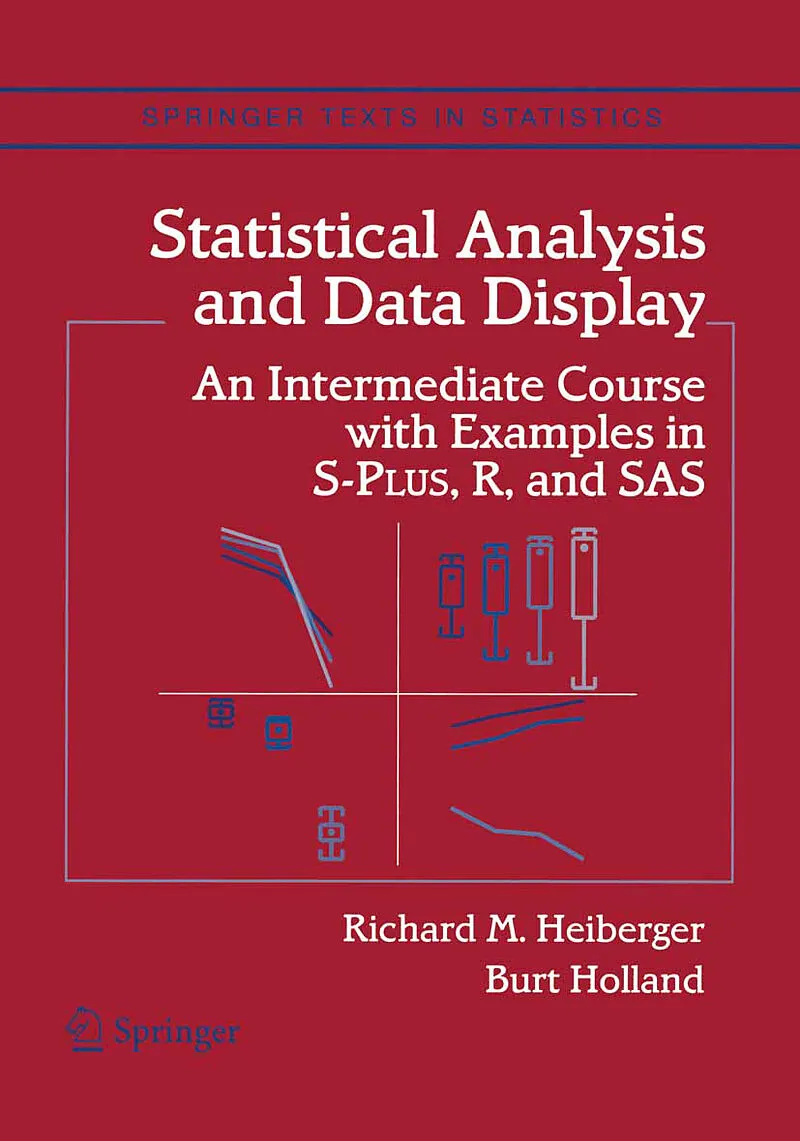
This book provides a concise overview of modern statistical topics at an elementary level. Assuming an understanding of basic calculus and a previous statistics course, it will serve as a reference book for applied statisticians in many quantitative areas who...
This book provides a concise overview of modern statistical topics at an elementary level. Assuming an understanding of basic calculus and a previous statistics course, it will serve as a reference book for applied statisticians in many quantitative areas who are interested in statistical methods. Each chapter introduces concepts and terminology, develops the rationale for its methods, and gives examples supported by graphs and computer output. There is an emphasis on graphical displays, and computeroutput is given in both S-PLUS and SAS.
Provides and discusses S-PLUS, R, and SAS executable functions and macros for all new graphical display formats All graphs and tabular output in the book were constructed using these programs
Autorentext
Richard M. Heiberger is Professor Emeritus in the Department of Statistics of Temple University, an elected Fellow of the American Statistical Association, and a former Chair of the Section on Statistical Computing of the American Statistical Association. He was Graduate Chair for the Department of Statistics and Acting Associate Vice Provost for the University. He participated in the design of the linear model and analysis of variance functions while on research leave at Bell Labs. He has taught short courses at the Joint Statistics Meetings, the American Statistical Association Conference on Statistical Practice, the R Users Conference, and the Deming Conference on Applied Statistics. He has consulted with several pharmaceutical companies. Burt Holland was Professor in the Department of Statistics of Temple University, an elected Fellow of the American Statistical Association, Chair of the Department of Statistics of Temple University, and Chair of Collegial Assembly of the Fox School. He has taught short courses at the Joint Statistics Meetings and the Deming Conference on Applied Statistics. He has made many contributions to linear modeling and simultaneous statistical inference. He frequently served as consultant to medical investigators. He developed a very popular General Education course on Statistics and the News.
Klappentext
This presentation of statistical methods features extensive use of graphical displays for exploring data and for displaying the analysis. The authors demonstrate how to analyze data-showing code, graphics, and accompanying computer listings. They emphasize how to construct and interpret graphs, discuss principles of graphical design, and show how tabular results are used to confirm the visual impressions derived from the graphs. Many of the graphical formats are novel and appear here for the first time in print.
Inhalt
1 Introduction and Motivation.- 2 Data and Statistics.- 3 Statistics Concepts.- 4 Graphs.- 5 Introductory Inference.- 6 One-Way Analysis of Variance.- 7 Multiple Comparisons.- 8 Linear Regression by Least Squares.- 9 Multiple RegressionMore Than One Predictor.- 10 Multiple RegressionDummy Variables and Contrasts.- 11 Multiple RegressionRegression Diagnostics.- 12 Two-Way Analysis of Variance.- 13 Design of ExperimentsFactorial Designs.- 14 Design of ExperimentsComplex Designs.- 15 Bivariate StatisticsDiscrete Data.- 16 Nonparametrics.- 17 Logistic Regression.- 18 Time Series Analysis.- A Software.- A.1 Statistical Software.- A.2 Text Editing Software.- A.2.1 Emacs.- A.2.2 Microsoft Word.- A.3 Word Processing Software.- A.3.2 Microsoft Word.- A.4 Graphics Display Software.- A.5 Operating Systems.- A.6 Mathematical Fonts.- A.7 Directory Structure.- A.7.1 HOME Directory.- A.7.2 HH Book Online Files.- B.1 Create Your Working Directory and Make the HH Library Available.- B.1.3 Windows and R.- B.1.6 Unix and R.- B.4 HH Library Functions.- B.5 Learning the S Language.- B.6 S Language Style.- C SAS.- C.1 Make the HH Library Available.- C.1.1 Windows.- C.1.2 Unix.- C.2 Using SAS with HH.- C.2.1 Reading HH Datasets.- C.2.2 Any Other Data Files.- C.2.3 ASCII Data Files with TAB Characters.- C.2.4 Windows and Unix EOL (End-of-Line) Conventions.- C.3 Macros.- C.4 Learning the SAS Language.- C.5 SAS Coding Conventions.- D Probability Distributions.- D.1.1 An Example Involving Calculations with the Binomial Distribution.- D.2 Noncentral Probability Distributions.- E Editors.- E.1 Working Style.- E.2 Typography.- E.3 Emacs and ESS.- E.3.1 ESS.- E.3.2 Mouse and Keyboard.- E.3.3 Learning Emacs.- E.3.4 Requirements.- E.4 Microsoft Word.- E.4.1 Learning Word.- E.4.2Requirements 6.- E.5 Microsoft Excel.- E.5.1 Database Management.- E.5.2 Organizing Calculations.- E.5.3 Excel as a Statistical Calculator.- E.6 Exhortations, Some of Which Are Writing Style.- E.6.1 Writing Style.- E.6.2 Programming Style and Common Errors.- E.6.3 Presentation of Results.- F Mathematics Preliminaries.- F.1 Algebra Review.- F.2 Elementary Differential Calculus.- F.3 An Application of Differential Calculus.- F.4 Topics in Matrix Algebra.- F.4.1 Elementary Operations.- F.4.2 Linear Independence.- F.4.3 Rank.- F.4.4 Quadratic Forms.- F.4.5 Orthogonal Transformations.- F.4.6 Orthogonal Basis.- F.4.8 Matrix FactorizationCholesky.- F.4.9 Orthogonal Polynomials.- F.4.10 Projection Matrices.- F.4.11 Geometry ot Mlatrices.- F.4.12 Eigenvalues and Eigenvectors.- F.4.13 Singular Value Decomposition.- F.4.14 Generalized Inverse.- F.4.15 Solving Linear Equations.- F.5 Combinations and Permutations.- F.5.1 Factorial.- F.5.2 Permutations.- F.5.3 Combinations.- F.6 Exercises.- G Graphs Based on Cartesian Products.- G.1 Structured Sets of Graphs.- G.1.1 Cartesian Products.- G.1.2 Trellis Paradigm.- G.2 Scatterplot Matrices: splom and xysplom.- G.3 Cartesian Products of Sets of Functions.- G.4 Graphs Requiring Multiple Calls to xysplom.- G.5 Asymmetric Roles for the Row and Column Sets.- G.6 Rotated Plots.- G.7 Squared Residual Plots.- G.8 Alternate Presentations.- References.- List of Datasets.