
IHR WARENKORB IST AKTUELL LEER.
Haben Sie noch nichts passendes gefunden? Stöbern Sie durch unser komplettes Sortiment.
Oder melden Sie sich an bzw. registrieren Sie sich.
- Kostenlose Lieferung
- Kauf auf Rechnung
- Ex Libris Tiefpreis
- Filiallieferung und 650+ Abholorte
- Rabatt-Bons als Club-Mitglied
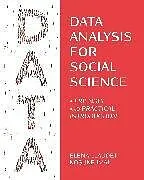
Data Analysis for Social Science
Beschreibung
Autorentext Elena Llaudet and Kosuke Imai Klappentext An ideal textbook for complete beginners—teaches from scratch R, statistics, and the fundamentals of quantitative social science Data Analysis for Social Science provides a friendly introduction to th...Format auswählen
- Kartonierter EinbandCHF 61.60

Wird oft zusammen gekauft
Andere Kunden kauften auch
Beschreibung
Autorentext
Elena Llaudet and Kosuke Imai
Klappentext
An ideal textbook for complete beginners—teaches from scratch R, statistics, and the fundamentals of quantitative social science
Data Analysis for Social Science provides a friendly introduction to the statistical concepts and programming skills needed to conduct and evaluate social scientific studies. Assuming no prior knowledge of statistics and coding and only minimal knowledge of math, the book teaches the fundamentals of survey research, predictive models, and causal inference while analyzing data from published studies with the statistical program R. It teaches not only how to perform the data analyses but also how to interpret the results and identify the analyses’ strengths and limitations.
- Progresses by teaching how to solve one kind of problem after another, bringing in methods as needed. It teaches, in this order, how to (1) estimate causal effects with randomized experiments, (2) visualize and summarize data, (3) infer population characteristics, (4) predict outcomes, (5) estimate causal effects with observational data, and (6) generalize from sample to population.
- Flips the script of traditional statistics textbooks. It starts by estimating causal effects with randomized experiments and postpones any discussion of probability and statistical inference until the final chapters. This unconventional order engages students by demonstrating from the very beginning how data analysis can be used to answer interesting questions, while reserving more abstract, complex concepts for later chapters.
- Provides a step-by-step guide to analyzing real-world data using the powerful, open-source statistical program R, which is free for everyone to use. The datasets are provided on the book’s website so that readers can learn how to analyze data by following along with the exercises in the book on their own computer.
- Assumes no prior knowledge of statistics or coding.
- Specifically designed to accommodate students with a variety of math backgrounds. It includes supplemental materials for students with minimal knowledge of math and clearly identifies sections with more advanced material so that readers can skip them if they so choose.
- Provides cheatsheets of statistical concepts and R code.
- Comes with instructor materials (upon request), including sample syllabi, lecture slides, and additional replication-style exercises with solutions and with the real-world datasets analyzed. Looking for a more advanced introduction? Consider Quantitative Social Science by Kosuke Imai. In addition to covering the material in Data Analysis for Social Science, it teaches diffs-in-diffs models, heterogeneous effects, text analysis, and regression discontinuity designs, among other things.
Inhalt
Preface1 Introduction1.1 Book Overview1.2 Chapter Summaries1.3 How to Use This Book1.4 Why Learn to Analyze Data?
1.4.1 Learning to Code1.5 Getting Ready1.6 Introduction to R
1.6.1 Doing Calculations in R
1.6.2 Creating Objects in R
1.6.3 Using Functions in R1.7 Loading and Making Sense of Data
1.7.1 Setting the Working Directory
1.7.2 Loading the Dataset
1.7.3 Understanding the Data
1.7.4 Identifying the Types of Variables Included
1.7.5 Identifying the Number of Observations1.8 Computing and Interpreting Means
1.8.1 Accessing Variables inside Dataframes
1.8.2 Means1.9 Summary1.10 Cheatsheets
1.10.1 Concepts and Notation
1.10.2 R Symbols and Operators
1.10.3 R Functions2 Estimating Causal Effects with Randomized Experiments2.1 Project STAR2.2 Treatment and Outcome Variables
2.2.1 Treatment Variables
2.2.2 Outcome Variables2.3 Individual Causal Effects2.4 Average Causal Effects
2.4.1 Randomized Experiments and the Difference-in-Means Estimator2.5 Do Small Classes Improve Student Performance?
2.5.1 Relational Operators in R
2.5.2 Creating New Variables
2.5.3 Subsetting Variables2.6 Summary2.7 Cheatsheets
2.7.1 Concepts and Notation
2.7.2 R Symbols and Operators
2.7.3 R Functions3 Inferring Population Characteristics via Survey Research3.1 The EU Referendum in the UK3.2 Survey Research
3.2.1 Random Sampling
3.2.2 Potential Challenges3.3 Measuring Support for Brexit
3.3.1 Predicting the Referendum Outcome
3.3.2 Frequency Tables
3.3.3 Tables of Proportions3.4 Who Supported Brexit?
3.4.1 Handling Missing Data
3.4.2 Two-Way Frequency Tables
3.4.3 Two-Way Tables of Proportions
3.4.4 Histograms
3.4.5 Density Histograms
3.4.6 Descriptive Statistics3.5 Relationship between Education and the LeaveVote in the Entire UK
3.5.1 Scatter Plots
3.5.2 Correlation3.6 Summary3.7 Cheatsheets
3.7.1 Concepts and Notation
3.7.2 R Symbols and Operators
3.7.3 R Functions4 Predicting Outcomes Using Linear Regression4.1 GDP and Night-Time Light Emissions4.2 Predictors, Observed vs. Predicted Outcomes, andPrediction Errors4.3 Summarizing the Relationship between Two Variables with a Line
4.3.1 The Linear Regression Model
4.3.2 The Intercept Coefficient
4.3.3 The Slope Coefficient
4.3.4 The Least Squares Method4.4 Predicting GDP Using Prior GDP
4.4.1 Relationship between GDP and Prior GDP
4.4.2 With Natural Logarithm Transformations4.5 Predicting GDP Growth Using Night-Time LightEmissions4.6 Measuring How Well the Model Fits the Data with the Coefficient of Determination, R2
4.6.1 How Well Do the Three Predictive Modelsin This Chapter Fit the Data?4.7 Summary4.8 Appendix: Interpretation of the Slope in the Log-Log Linear Model4.9 Cheatsheets
4.9.1 Concepts and Notation
4.9.2 R Functions5 Estimating Causal Effects with Observational Data5.1 Russian State-Controlled TV Coverage of 2014Ukrainian Affairs5.2 Challenges of Estimating Causal Effects withObservational Data
5.2.1 Confounding Variables
5.2.2 Why Are Confounders a Problem?
5.2.3 Confounders in Randomized Experiments5.3 The Effect of Russian TV on Ukrainians’ VotingBehavior
5.3.1 Using the Simple Linear Model to Computethe Difference-in-Means Estimator
5.3.2 Controlling for Confounders Using aMultiple Linear Regression Model5.4 The Effect of Russian TV on Ukrainian ElectoralOutcomes
5.4.1 Using the Simple Linear Model to Computethe Difference-in-Means Estimator
5.4.2 Controlling for Confounders Using aMultiple Linear Regression Model5.5 Internal and External Validity
5.5.1 Randomized Experiments vs.Observational Studies
5.5.2 The Role of Randomization
5.5.3 How Good Are the Two Causal Analysesin This Chapter?
5.5.4 How Good Was the Causal Analysis inChapter 2?
5.5.5 The Coefficient of Determination, R25.6 Summary5.7 Cheatsheets
5.7.1 Concepts and Notation
5.7.2 R Functions6 Probability6.1 What Is Probability?6.2 Axioms of Probability6.3 Events, Random Variables, and ProbabilityDistributions6.4 Probability Distributions
6.4.1 The Bernoulli Distribution
6.4.2 The Normal Distribution
6.4.3 The Standard Normal Distribution
6.4.4 Recap6.5 Population Parameters vs. Sample Statistics
6.5.1 The Law of Large Numbers
6.5.2 The Central Limit Theorem
6.5.3 Sampling Distribution of the Sample Mean6.6 Summary6.7 Appendix: For Loops6.8 Cheatsheets
6.8.1 Concepts and Notation
6.8.2 R Symbols and Operators
6.8.3 R Functions7 Quantifying Uncertainty7.1 Estimators and Their Sampling Distributions7.2 Confidence Intervals
7.2.1 For the Sample Mean
7.2.2 For the Difference-in-Means Estimator
7.2.3 For Predicted Outcomes7.3 Hypothesis Testing
7.3.1 With the Difference-in-Means Estimator
7.3.2 With Estimated Regression Coefficients7.4 Statistical vs. Scientific Signifi…